1.4.1 Using the OneGeology Portal
1.4.1.1 Viewing map data registered in the OneGeology Portal
The OneGeology Portal is found at: https://portal.onegeology.org/ and is accessible as either an English (the default) or French language service.
You will need to use Internet Explorer 6 and above, Firefox 2 and above or recent versions of Safari, Opera, and Chrome. You will need to enable JavaScript and allow pop-ups.
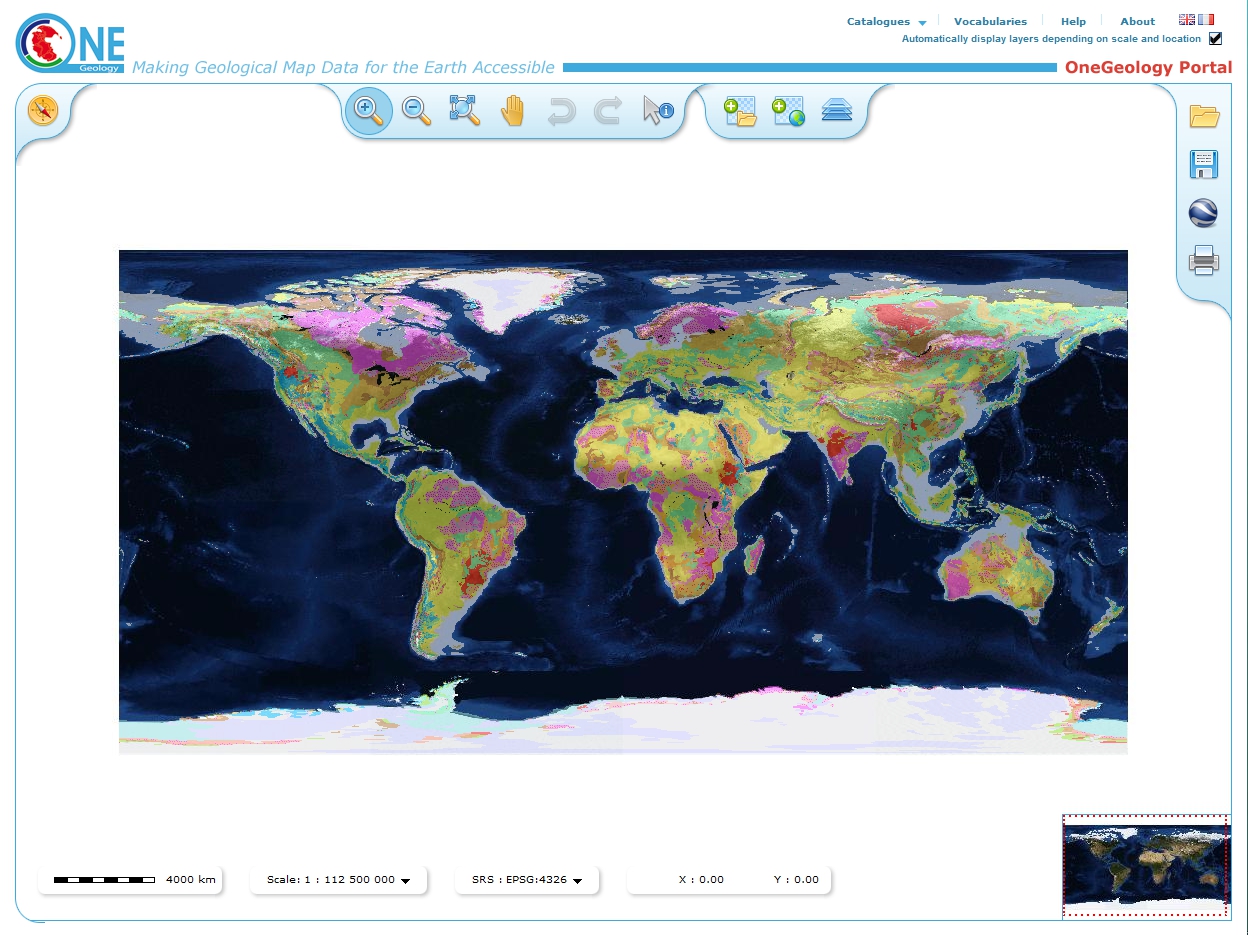
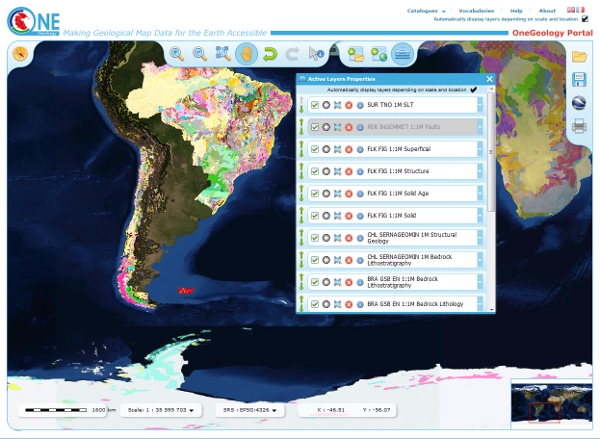
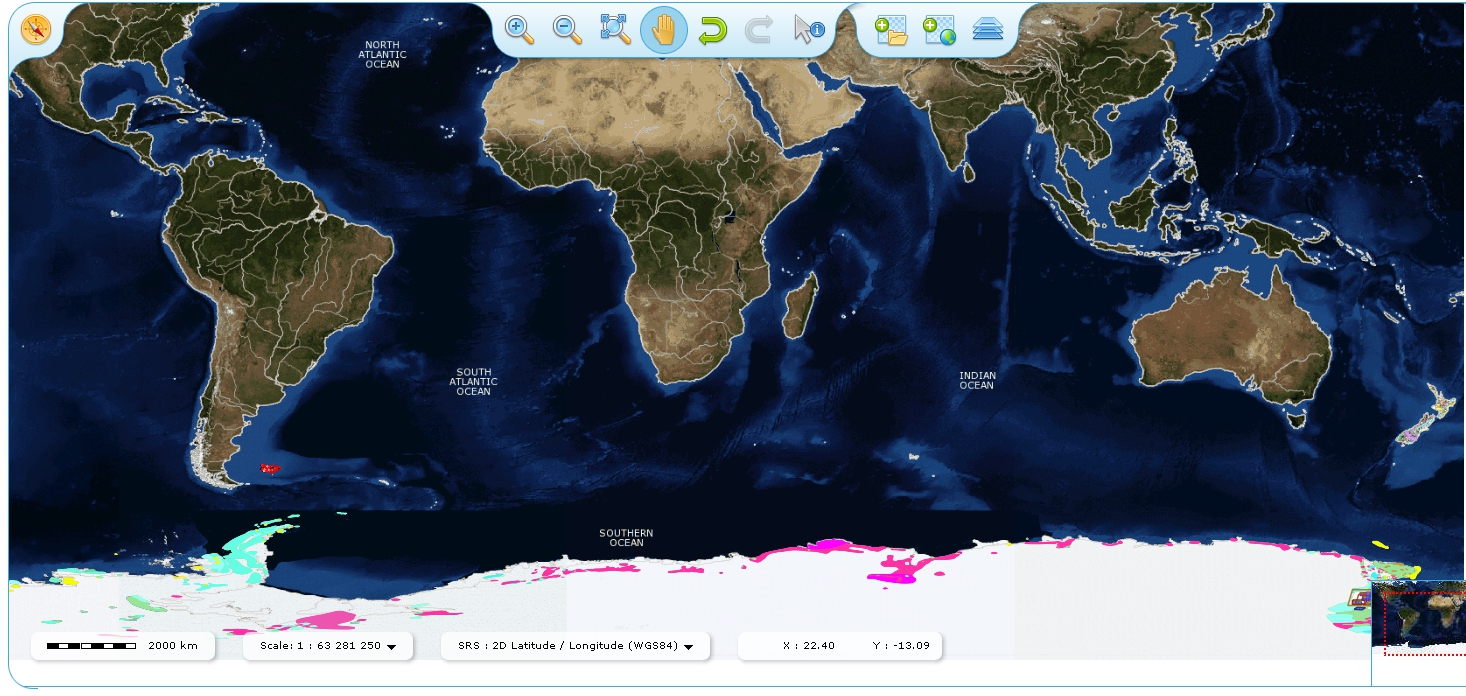
When you open the OneGeology Portal you get a map of the world, the Blue Marble: Next Generation+Topo+Bathy (Terra/MODIS)(http://visibleearth.nasa.gov/view_detail.php?id=7105). By default you now also get some automatically selected geology map layers, depending on the scale you are zoomed into. For example, at full map extent you now get the ‘World CGMW 1:50M Geological Units Onshore’ map.
You may at any time turn off the automatically selected layers by unticking the option ‘Automatically displayed layers depending on scale and location’ in the top right of the browser window.
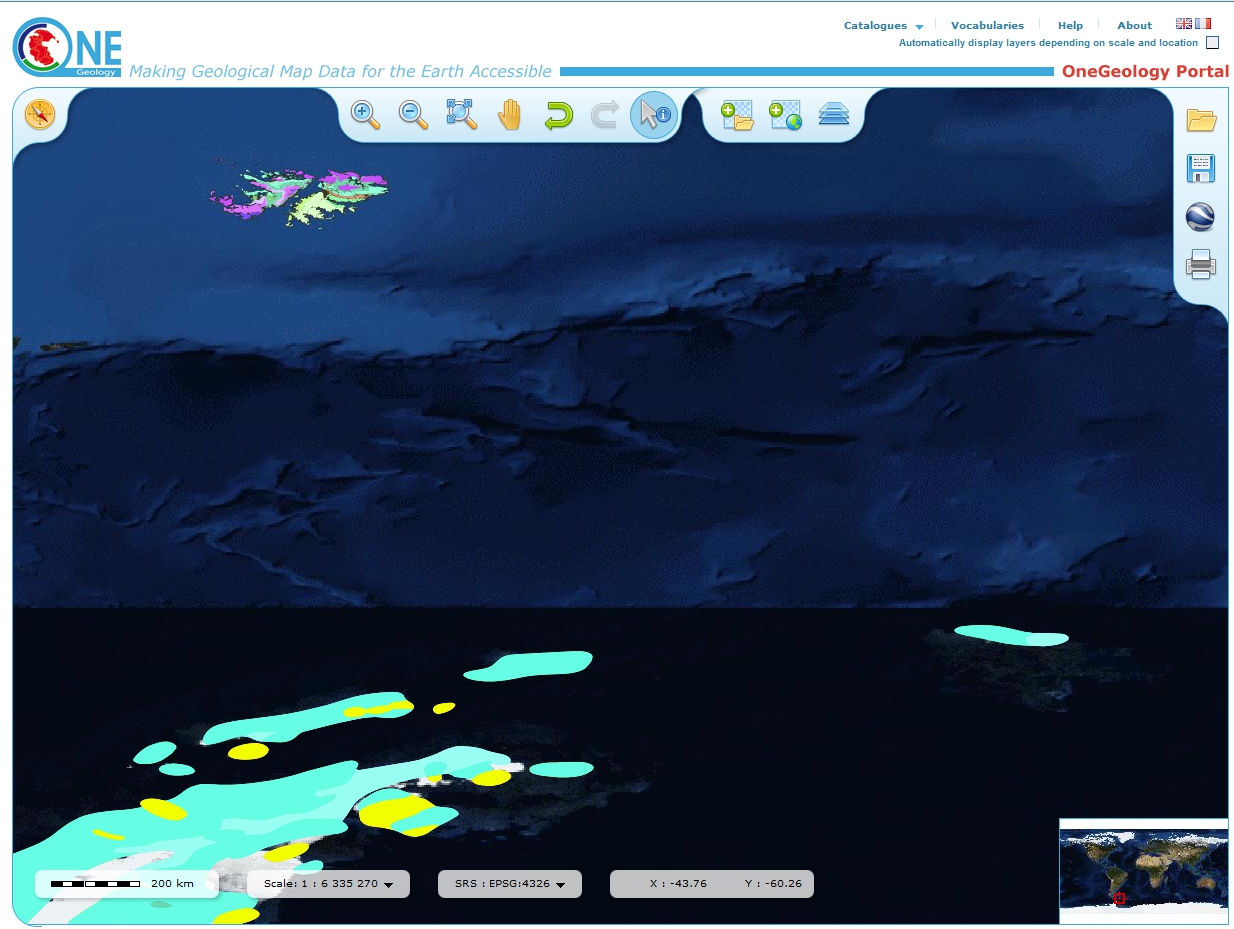
The overview window in the bottom right corner of the map indicates the area of the globe you are currently looking at in the map window, by means of a red outline map superimposed on the global map. For example in the above map the red outline is shown for the whole globe, but in the below map the red box is located in the Southern Ocean.
![]()
To view any other registered geology maps you need to click on the ‘Add OneGeology map layers’ icon to open the OneGeology Portal catalogue listing.
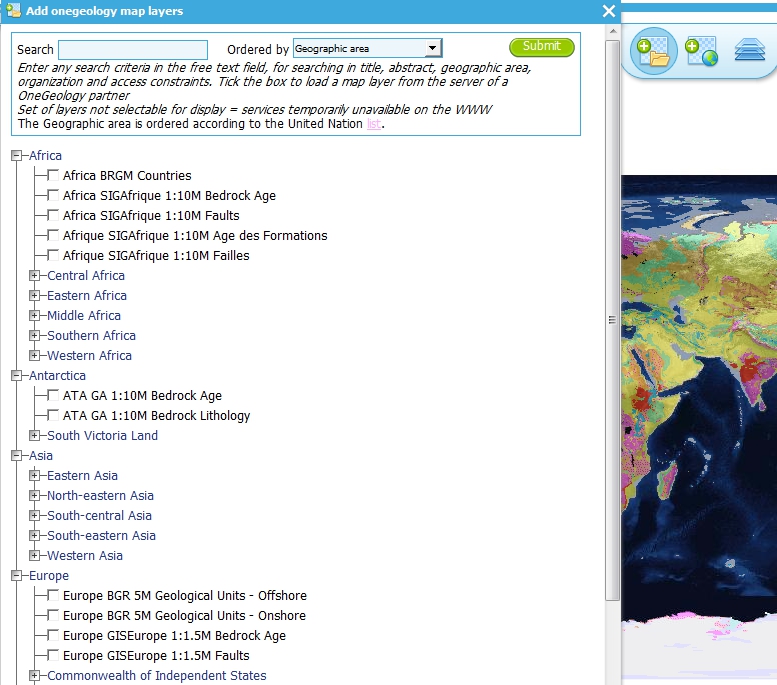
Click on the + buttons to expand the levels. Select a map by clicking on the box to the left of the map you wish to view. A tick will appear.
Select all the map layers you wish to view at this time before closing the catalogue listing. The selected maps should then be visible. You can add other layers later on if you desire.
You may navigate around the map using the GIS tools found at the top of the page. The functions of these tools is as follows (from left to right):
![]()
- Zoom in — click on this image and then click on the world background map to zoom in centred on the clicked location. Click and drag a rectangle to zoom to a specific area.
- Zoom out — click on this image and then click on the world background map to zoom out centred on the clicked location. Click and drag a rectangle to zoom out from a specific area
- View full global extent — click this image to start again with a view of the full world background map.
- Pan by clicking and dragging the map to move — click this image and then click and drag on the map to move to a different area (north, west, etc)
- Return back to previous map view
- If you have gone back to a previous view, you may use this tool to go forward.
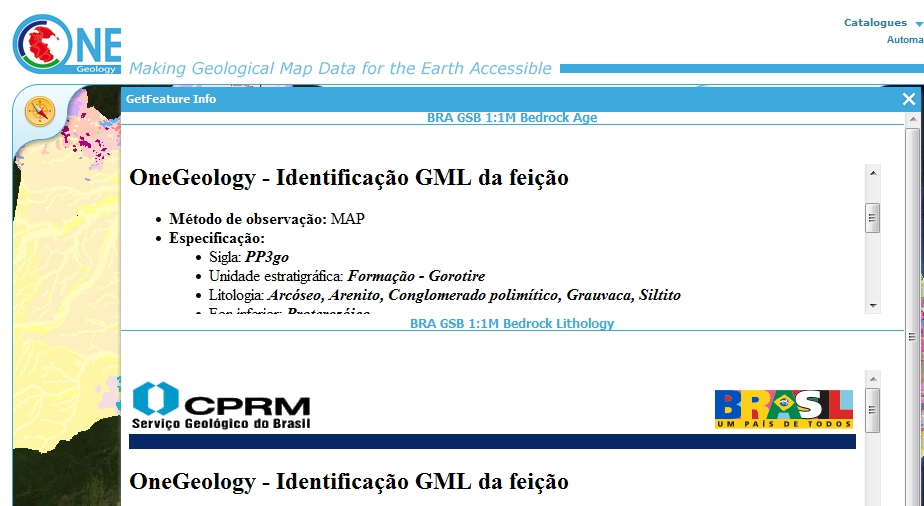
- Use this tool to get more information about the active map layers (this is termed a GetFeatureInfo request). Select the tool and click the map to open up a new window with detailed information about the geology at that point. The information returned and format of the information varies from map to map and layer to layer dependant upon how much information the provider organization wishes to display and the capabilities of the service.
![]()
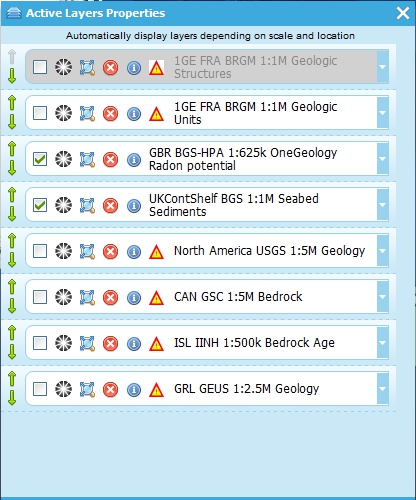
To view metadata about the map layers and to change the way the layers are displayed you need to Click on the ‘Active Layers Properties’ icon. This will open a list of all the map layers that you have selected to be viewed in the OneGeology Portal; it will now also display all the map layers that have been automatically selected.
Within this dialogue menu you can manage the individual layers in the following ways (looking at the icons from left to right):
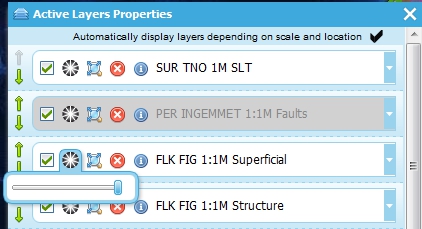
- Move the map layer up (so it lies above other layers and may obscure them), and move the map layer down (so it lies beneath other layers and may be obscured by them). In the figure we can see that we cannot move the SUR TNO 1M SLT further up because the up away is greyed out.
- Show or hide the map layer.
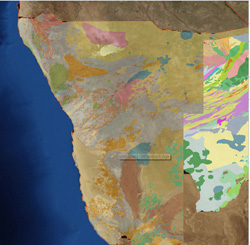
- Change the opacity of the map layer (use the slider rule to change the % value to make underlying maps visible) so that it is possible to see through a layer to underlying layers where they overlap
- Zoom to the extent of the map layer to make that particular map layer fill the centre of the map browser.
- Delete the map layer from the view (you can add it back again later).
Note the i icon has no actual function, it just exists to inform you whether the layer is queryable, that is whether you can perform a GetFeatureInfo request on it and get back some information. Note too, in the above figure that one of the layers is shown to be greyed out. A greyed out layer indicates that the layer (such as PER INGEMMET 1:1M Faults, is not visible at the selected map scale. Finally note we can show or hide all the automatically selected layers by unticking the ‘Automatically displayed layers depending on scale and location’ option at the top of the dialogue window.

To find out further information about any map layer you can click the arrow to right of the layer title; inforamtion found here is extracted from the service GetCapabilites response document and includes information such as:
- The data owner
- The service title
- The legend of the map layer
- Information about the layer data and other digital data services of the data provider
- TC211/ISO 19115:2003 or FGDC metadata for the layer
- The service URL (you can use this URL to view the OneGeology WMS layer in any WMS client as described in later sections).
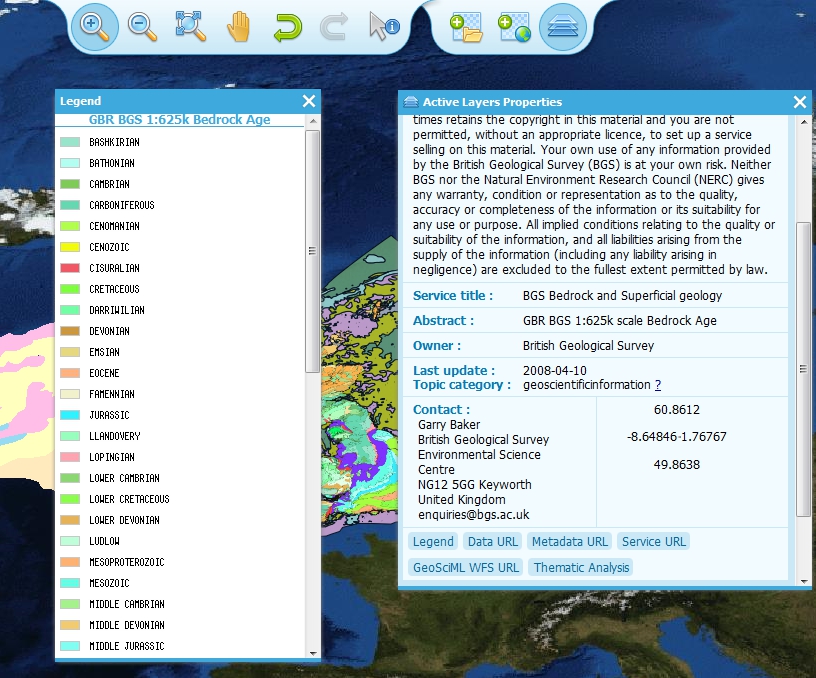
This (above) information is harvested automatically by the OneGeology Portal client software from the GetCapabilities response document of the WMS.
Go To
![]()
Click on the Go To (compass) icon to open a dialog box that allows you to zoom to an area by place name or Longitude and Latitude coordinates
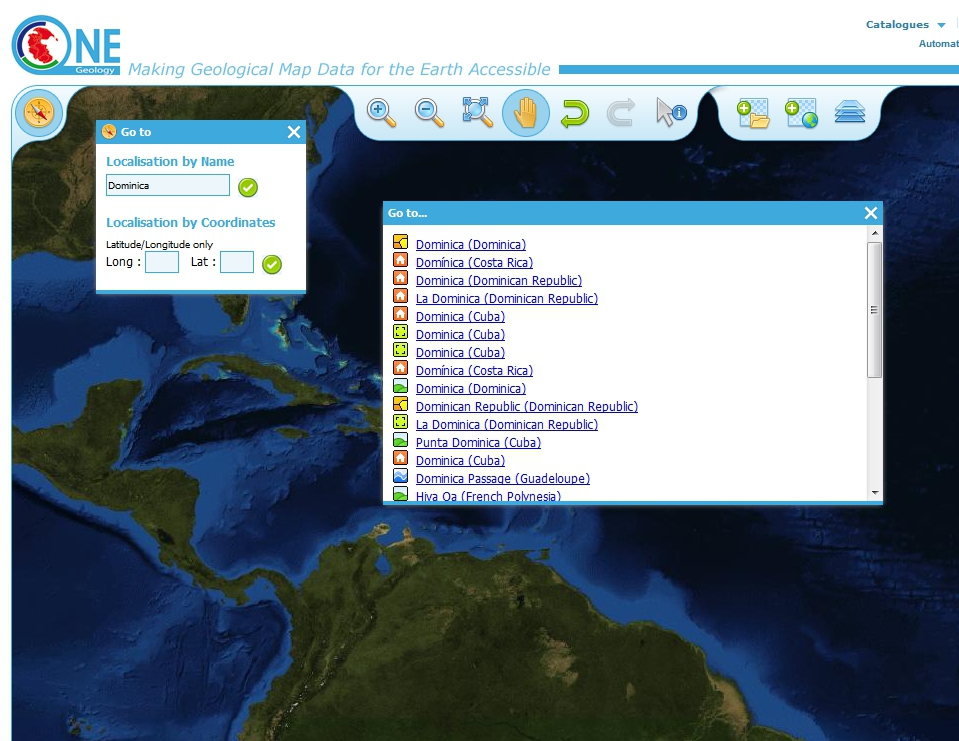
In the first example (below) we enter Dominica in the ‘Localisation by Name’ text box, then click the ‘Go to’ button to the right of it. This opens a second window that shows all the matches for Dominica in the OneGeology Portal gazeteer. Select the place name you want by clicking on it and the OneGeology Portal will zoom to that location. Note the OneGeology Portal only zooms to the area, it doesn’t necessarily open any available geology layers in that area.
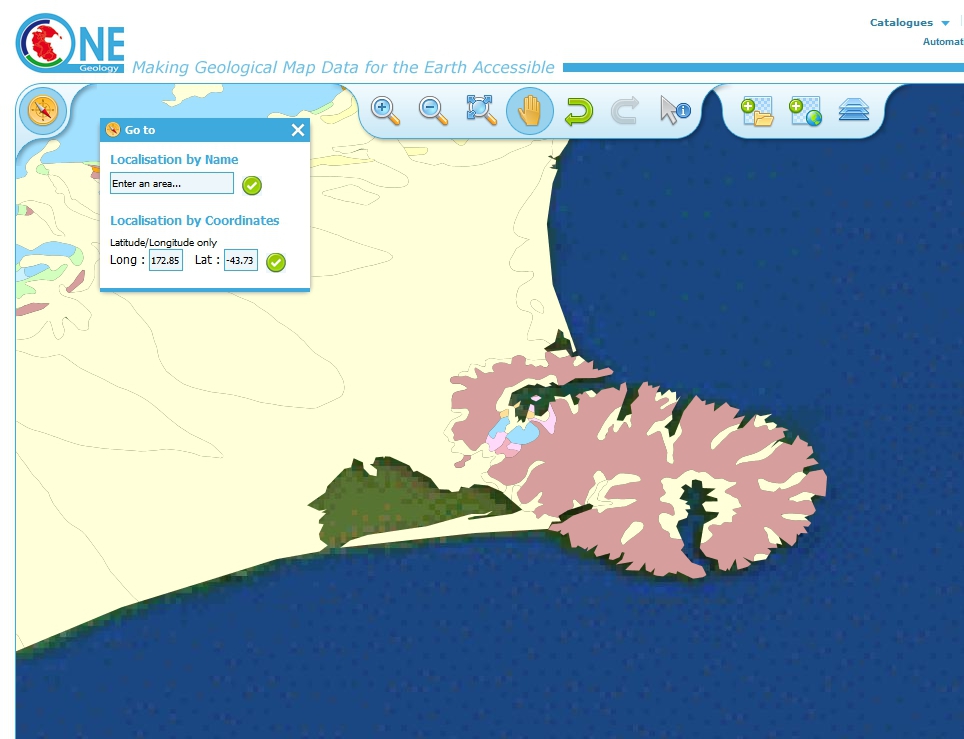
In the second example (below) we use the ‘Localisation by Coordinates’ form and enter 172.85 in the ‘Long:’ text box and -43.73 in the ‘Lat:’ text box and then click the ‘Go to’ button to the right of them. The OneGeology Portal will then zoom to the area of interest. Note the OneGeology Portal only zooms to the area, it doesn’t necessarily open any available geology layers in that area. In this example we already had the geology of New Zealand as an active layer.
Viewing layers in different projections
The portal allows you to select other projections to view the map layers. The projections supported by the portal are:
- EPSG:3031
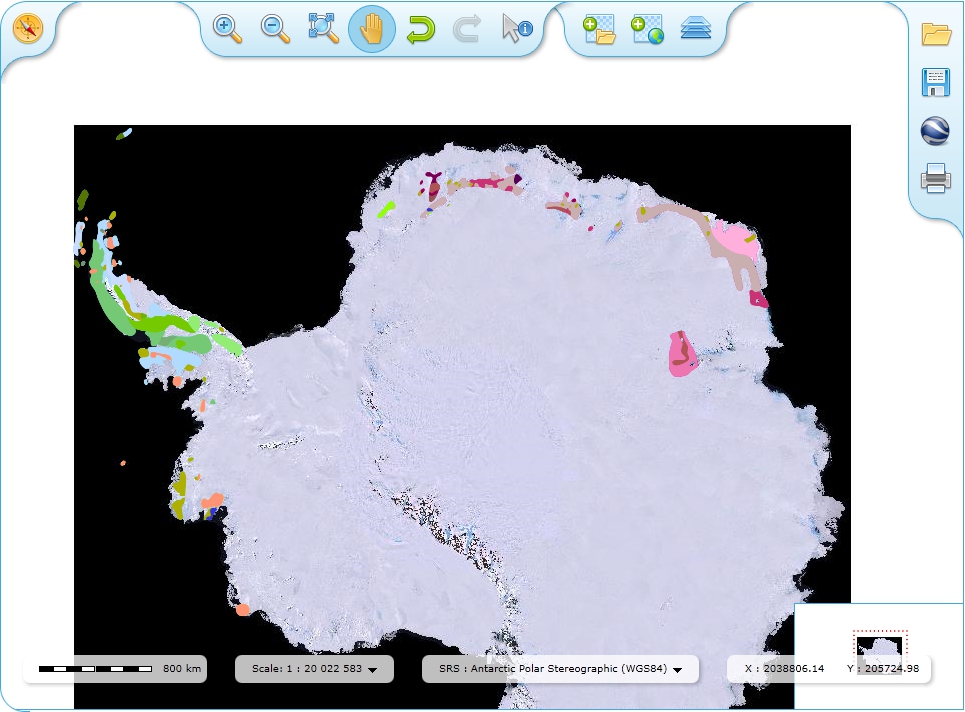
- Antarctic Polar Stereographic (WGS84) http://spatialreference.org/ref/epsg/3031/
- EPSG:3034
- Lambert Conformal Conic (ETRS89) http://spatialreference.org/ref/epsg/3034/
- EPSG:3413
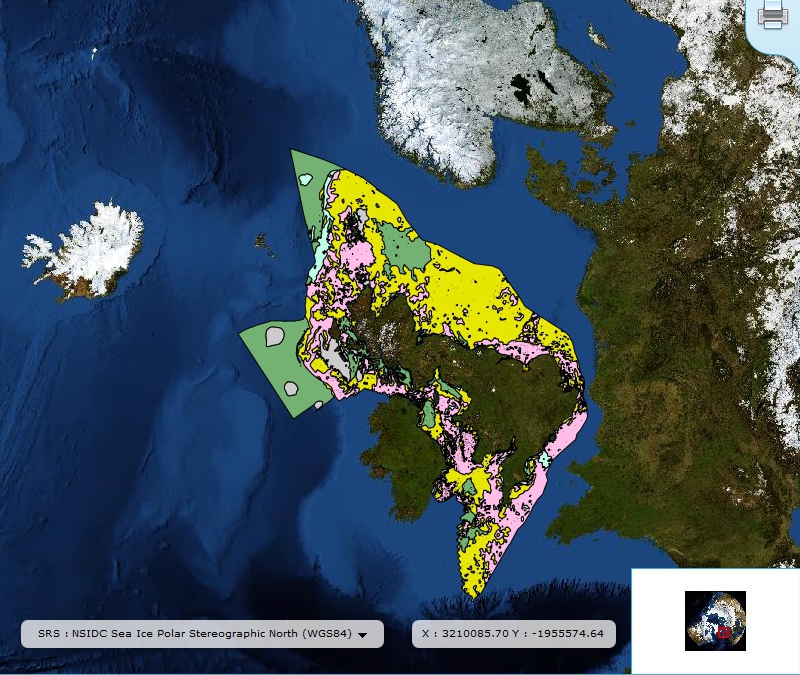
- NSIDC Sea Ice Polar Stereographic North (WGS84) http://www.spatialreference.org/ref/epsg/3413/
- EPSG:3857
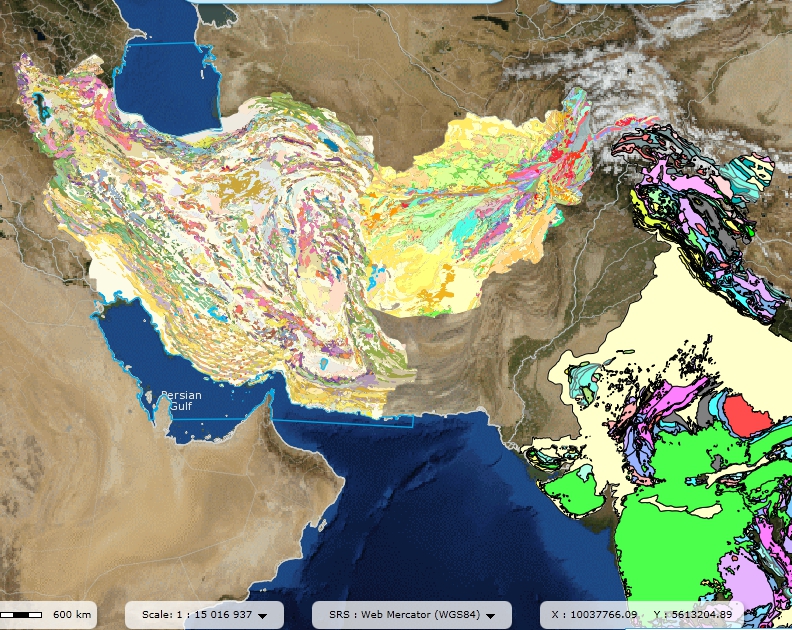
- Web Mercator (WGS84) http://spatialreference.org/ref/sr-org/7483/
- EPSG:4258
- 2D Latitude / Longitude (ETRS89) http://www.spatialreference.org/ref/epsg/4258/
- EPSG:4326
- 2D Latitude / Longitude (WGS84) http://spatialreference.org/ref/epsg/4326/
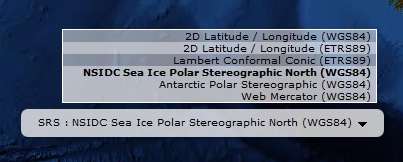
The default projection to view layers in the portal is 2D Latitude / Longitude (WGS84) or EPSG:4326. All layers in the portal must support this projection as part of their service. To select another projection you must use the list at the bottom of the main portal window. The current projection is shown in bold in the list, so for example in the below figure the active projection at the time of clicking the list was NSIDC Sea Ice Polar Stereographic North (WGS84).
Whilst all layers in the portal must support 2D Latitude / Longitude (WGS84), other projections are optional. When you choose to change to any projection other the default, you should expect that some layers will not support the newly selected projection; layers that do not support the selected projection are deselected (so the portal will not make any requests to them for map layers) and shown in the active layers properties window with a yellow warning triangle.
In many cases viewing the OneGeology layers in the default projection is sufficient, but in some cases, for example when you are dealing with layers close to the poles, a differnt projection better shows the data. For example compare the two images below showing map layers for Antarctica and surrounding regions. In the first example we have the default projection that shows Antarctica as a distorted strip of land at the bottom of the flattened globe.
In the second example, we have the same map layers shown in the Antarctic Polar Stereographic (WGS84) projection that shows Antarctica as it should be, as a single land mass. Note that the portal uses a different backdrop for this projection than that used for the default projection, namely the Landsat Image Mosaic of Antarctica (LIMA). Note too that this LIMA backdrop does not extend much further than the Antarctica land mass, so whilst there are map layers that support this projection other than Antarctica, for example the Falkland Islands (Malvinas) layers, there is currently no backdrop for these map layer extents.
Examples of other map layers in other projections are shown below:
NSIDC Sea Ice Polar Stereographic North (WGS84)
Web Mercator (WGS84)
2D Latitude / Longitude (ETRS89)
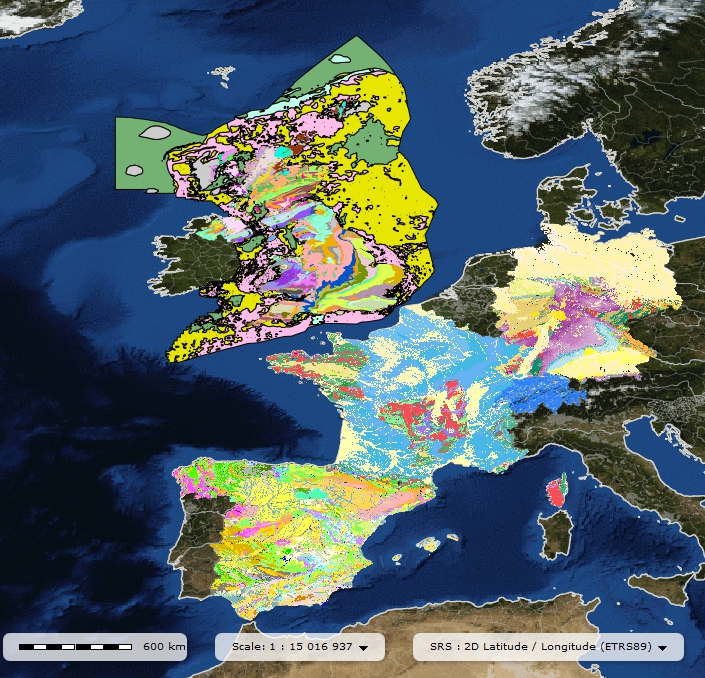
Note that when using the ETRS-89 based projections you will not be able to zoom out (or pan the map) wider than than the intended extent of the projection.
Section last modified: 24 September 2014